The purpose of this lab exercise is to study the possibility of using finite element modeling to study the behavior of sound at low frequencies in small rooms, i.e. below the Schroeder frequency.
Firstly, one will calculate the required frequency responses and source pressure distribution using FEMLAB. By that, one tries to confirm the sound field behaviour shown below for a rectangular room as a function of wall impedance at x=0 and x=lx. See Figure 1 below for the mode shapes considered.

Further, one studies a typical Swedish rectangular living room, defining the dimensions as L:W:H=5:4:2.4m. Damp the untreated room so that the RT for any mode is 1s. By adding typical furniture with various flow resistivity - define what is needed to lower the RT to 0.5s. Also define what happens with the modes in frequency and space.
As a last part introduce bass-traps tuned to the lowest resonance frequency and alter the placement of them. Further introduce two point-source LSP in the room with the height of 1m. Distance to side walls=1.2m and front wall=0.8. Use the transfer functions from FEMLAB to calculate the impulse response using inverse Fourier transforms.
Below in Figure 2,3 and 4 - the mode shapes for Z=[Inf j 2] for the wall is presented. Compare with the schematical sketch in the previous chapter.
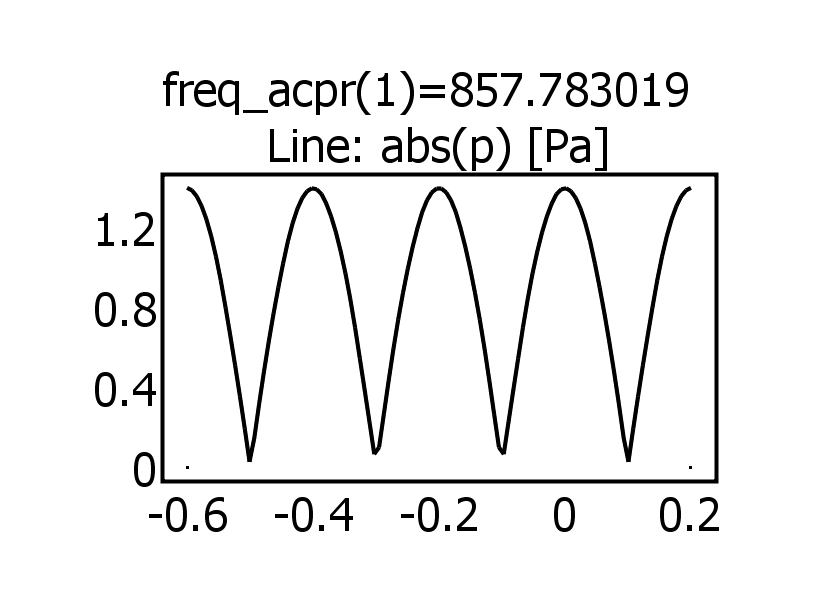 Figure 2: Mode shape for a 1D-room, Z=Inf |
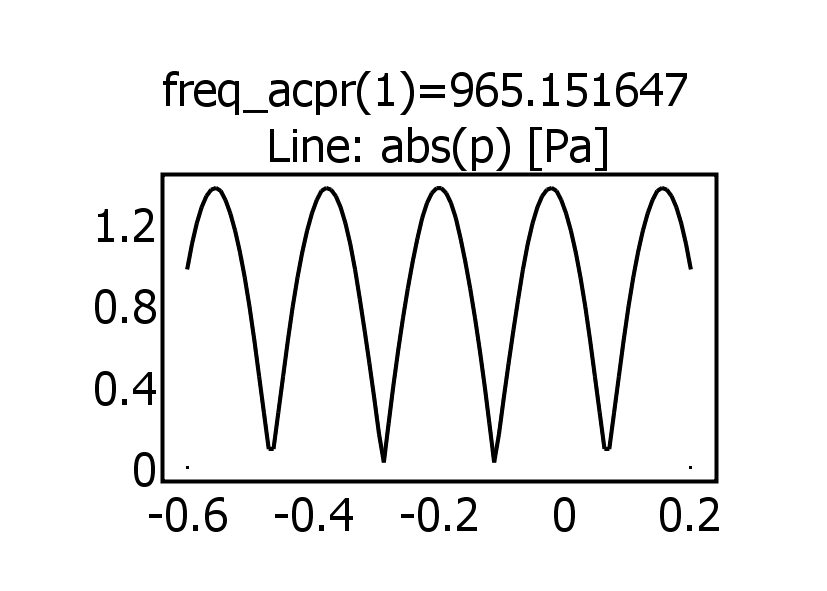 Figure 3: Mode shape for a 1D-room, Z=j |
 Figure 4: Mode shape for a 1D-room, Z=2 | |
Studying a typical Swedish living room with dimensions of LWH=5x4x2.4m - by adjusting the damping one wants to achieve a RT of 1s for any mode. For this room, one introduce a sofa and table and initially make them hard. By adjusting the placement of the sofa and table combination - one should study the modes in frequency and space. See Figure 5,6 and 7 regarding the SPL dependent of the placement.
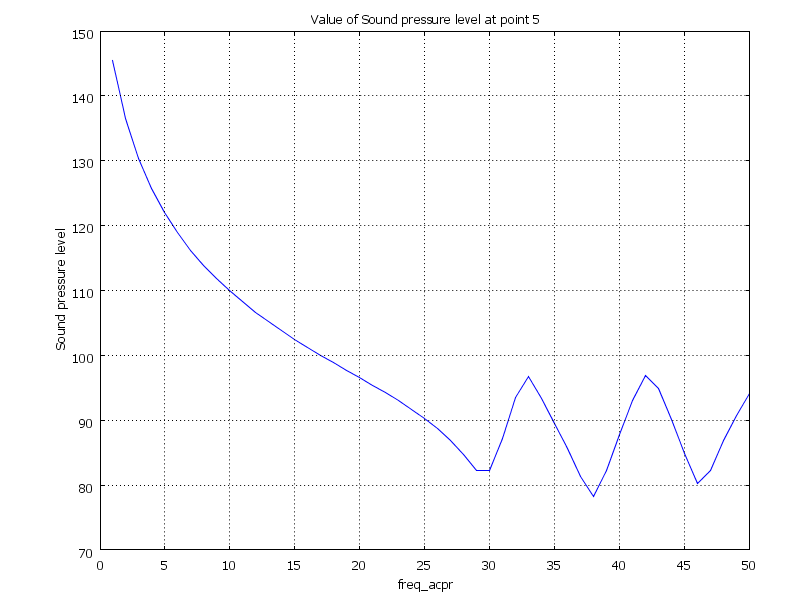 Figure 5: SPL for front placement |
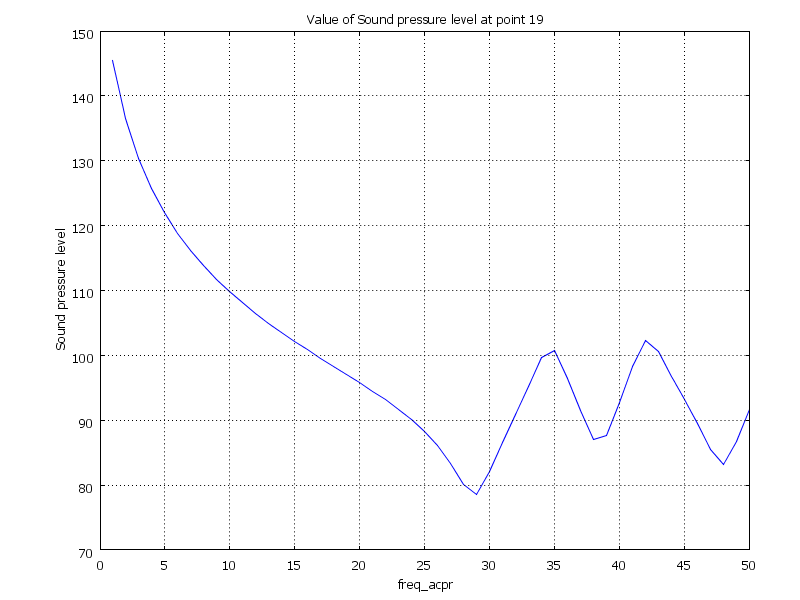 Figure 6: SPL for back placement |
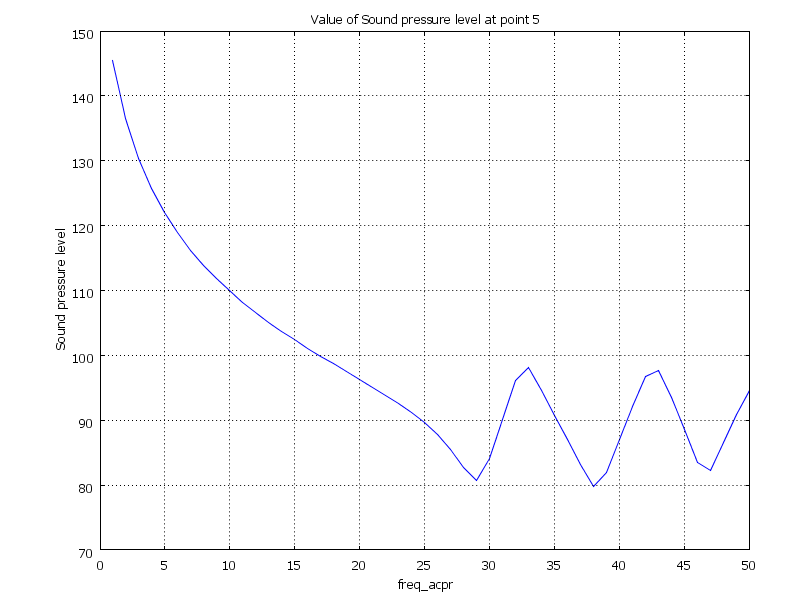 Figure 7: SPL for left placement |
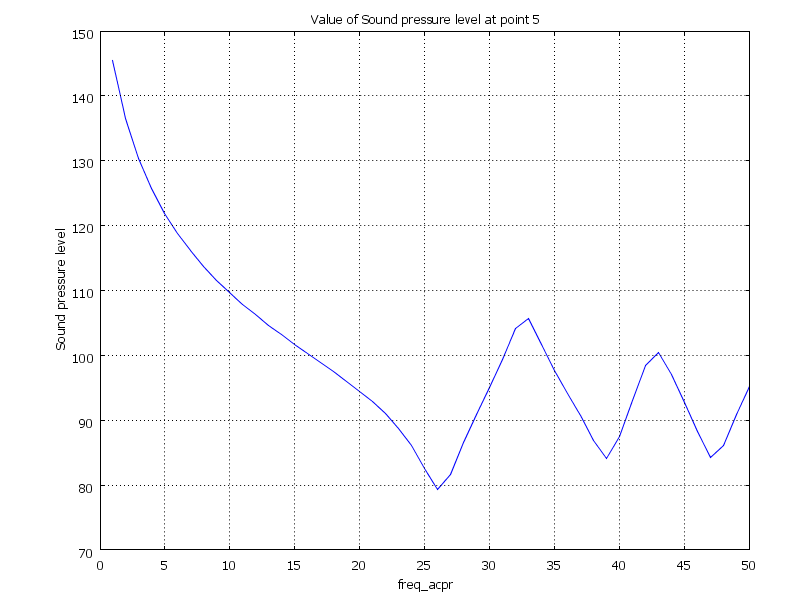 Figure 8: SPL for right placement |
Figure 5,6 and 7 above displays the sound pressure level between 0-50 Hz, at a point placed 1,2 metres from both walls and 1,2 meters above the floor. The four different figures displays how the sound pressure level changes depending on how the sofa and table is placed in the room, at the front, back or the to the left or to the right in the room.
Further on, the sought RT was of 0.5s. We managed to get it to 0.6s. Sound pressure levels are presented below together with a schematic view of the setup for the placement of the sofa in this task. See Figure 9,10,11 and 12.
 Figure 9: Schematic view |
 Figure 10: Sofa at the back |
 Figure 11: Sofa in the middle |
 Figure 12: Sofa by the side wall |
In this task, basstraps tuned to the lowest resonance frequency of the room (34.Hz) were to be created. To do this, hollow tubes with lengths correlating to 1/4 of the wavelength of this fundamental frequency were created in comsol and then placed in the virtual room. See Figure 13 below for the basstraps.

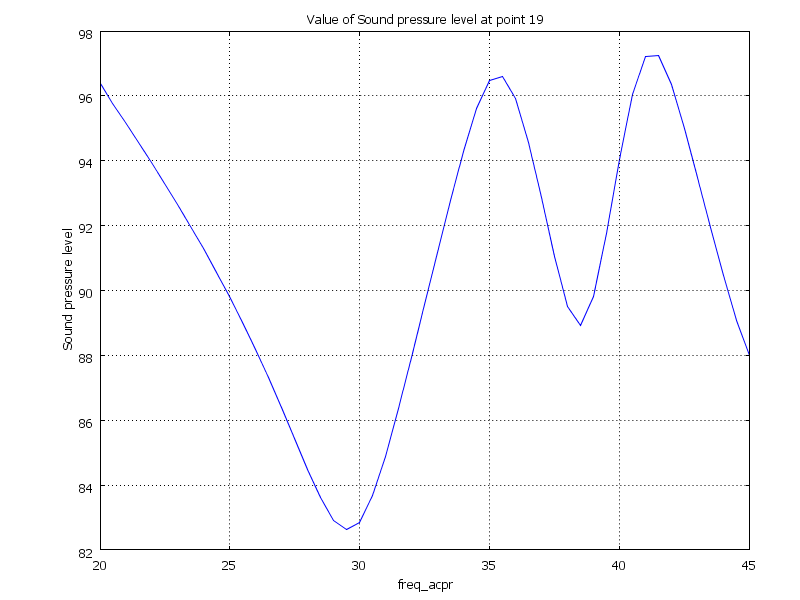 Figure 14: SPL for halfway together |
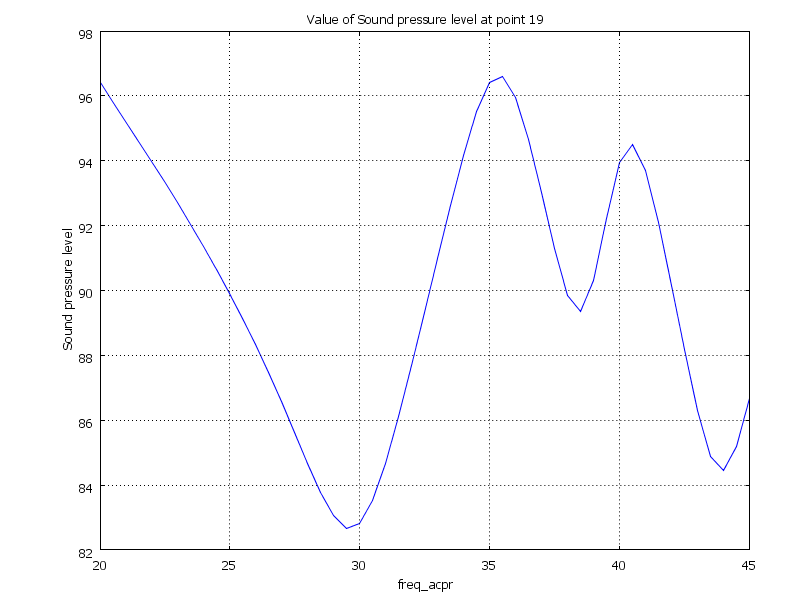 Figure 15: SPL for centered placement |
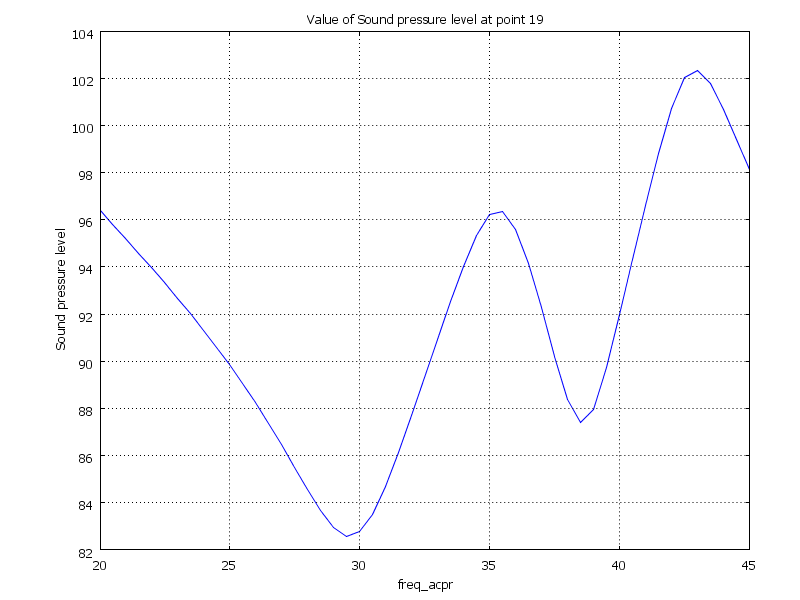 Figure 16: SPL for cornerplacement | |
For the last task, point source loudspeakers were to be created in the virtual room created in comsol. With these, the transfer function and the impulse response function to the listening points should be calculated. We have tried to do this for a long time during the weekend and holidays, but we must now realize that our knowledge in comsol is too limited to be able to do this task accurately. We would however really appreciate some guidance on how we were supposed to approach this task and what the desired result should look like.